BI Dashboards – A Vital Part of Answering Business Questions.
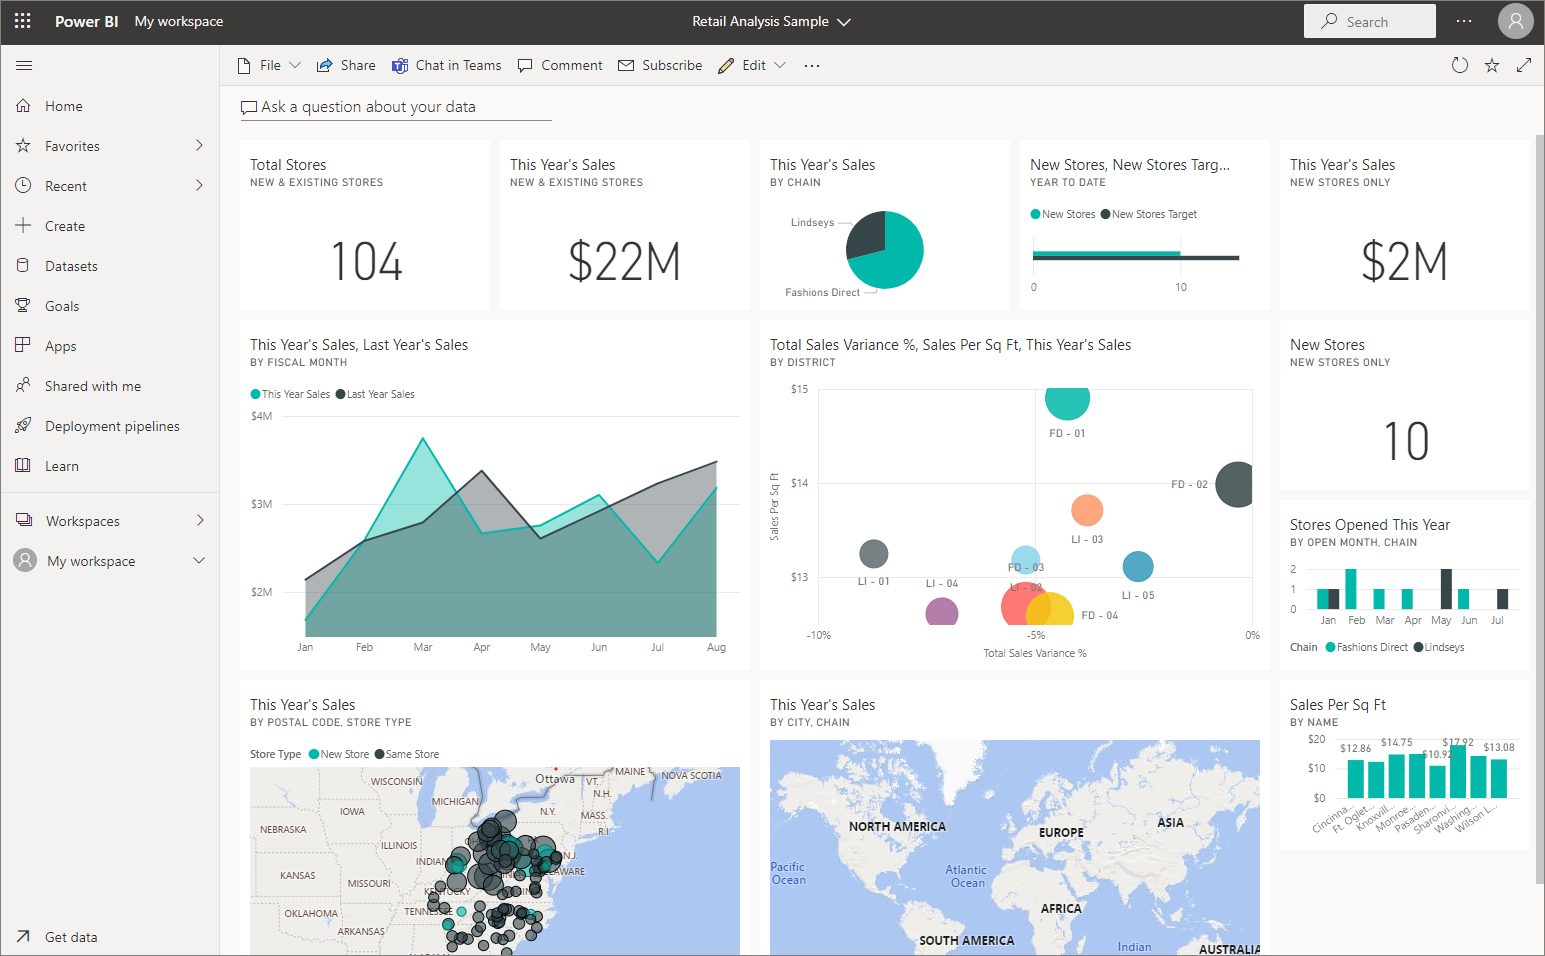
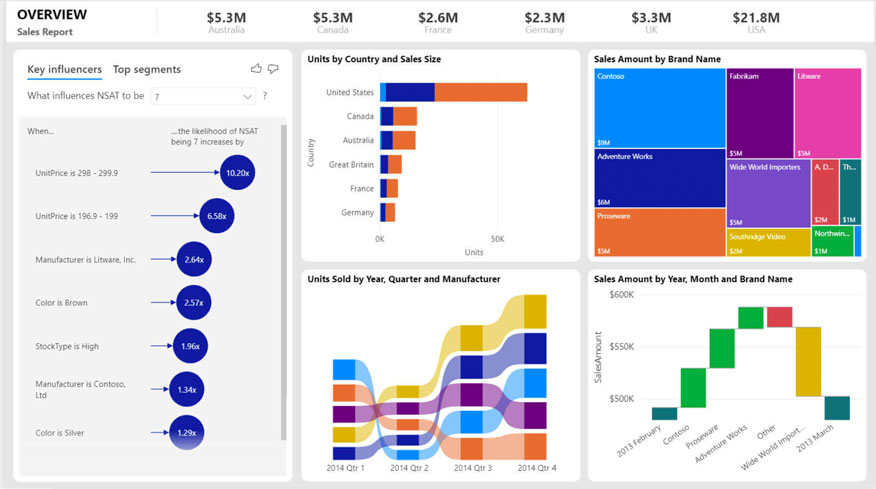
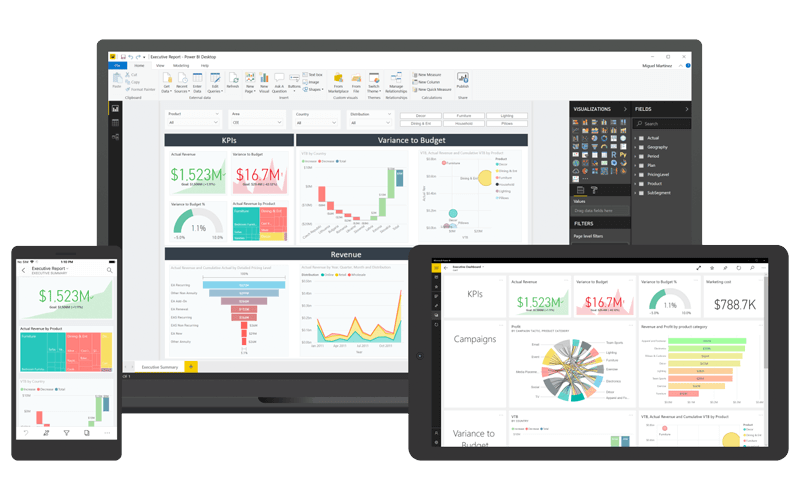
Have you ever wished your computer system could tell you what you need to know when you need to know it? You are not alone! Computer systems are supposed to provide all the data we need to make essential decisions on time. But do they? Too many times reports flood us with unnecessary information that obscures what we need to see. That is why BI (Business Intelligence) Dashboards are a vital part of providing a fast ‘big picture’ to your business questions.
Why the Disconnect?
The programmers who write the computer software were likely not given the information about what you need to see.
First, do you really want a 150-page accounts receivable report? No! You likely want to see one of two things: 1) Which customers owe me money? 2) Are they paying on a timely basis?
Second, you should see the total value of your inventory. 1) You could print the whole inventory valuation report, or 2) have a dashboard that breakdowns the information into digestible segments. You may want to see the split between raw materials, components, and finished goods. A simple dashboard gives you this at a glance.
Computers are good at spitting out data-based reports, but does it distill the data into actionable information that alerts you to upcoming problems? Probably not. As a result, there is a great deal of industry talk and development around BI Dashboards. These products are the software industries attempt to respond to the need for actionable information.
Dashboards Provide a Safety Net
Think about driving your car. Do you need to know how many ounces of gas are in your tank? No, you have a gas gauge that tells you the status of your gas supply and a light that comes on when you are down to the last two gallons. If that’s not enough, an electronic sound chimes at the same time. Why did they program your car to flash a light and make a sound when you already have a gas gauge? Shouldn’t that be enough? Because we are busy and are thinking about something else. We need a reminder so we don’t get stranded. BI Dashboards fill a similar need.
Back to our Accounts Receivable illustration. You have an Aged AR report – similar to knowing how many ounces of gas are in your tank. In addition, you probably have an overdue report – similar to your gas gauge. However, hundreds or thousands of individual invoices make up your receivables total; each is approaching an early pay discount date, a due date, or a long past due date. That is the first sign that you have a problem.
Example: Your customer’s average days to pay is 10 to take advantage of your early pay discount. What would the impact be if your business system notified your staff when an invoice exceeded the customer’s average days to pay threshold? The notification would provide a 20-day jump on a potential problem.
Perhaps there is a problem with that invoice. Do you want someone to act to determine if there is an issue? Not if it is a small invoice, but you may want someone to act if it’s a more significant invoice. Consider this as an example of a production-type alert or Dashboard.
Management Dashboards
Let’s look at an AR Management Dashboard. You know what numbers the bank or your CEO wants for total dollars and aged AR. If your accounting manager, controller, or CFO has a dashboard that displays just those numbers, they will quickly spot positive or negative trends without running and analyzing multiple reports run over a series of days.
When this happens, you need more information, and by the time you know it, the baseline has changed, and all the reports need to be rerun to have the same starting point. With a Dashboard, all it takes is a quick glance or email when something exceeds a threshold so action can start.
Top Management Dashboards
Here is where we need the flashing lights. These AR numbers should not be on the CEO’s Dashboard. However, if a problem starts appearing, it might be appropriate to have a warning before a small grass fire turns into a raging forest fire.
BI Dashboards Are Critical
Dashboards are the one place to get an instant view of your business health, the same way your car’s Dashboard provides your car’s status. Dashboards are not the only source of information, but they provide status updates on the critical components of your ERP or CRM system measures.
Can it tell you if your engineering department needs help with a new product design? Theoretically, yes, but practically, probably not. Will it tell you the maintenance status of the forklift in your warehouse? It could, but it’s best to focus on the things that are immediately measurable within your ERP or CRM system.
Top 4 Areas Dashboards Increase Effectiveness
Inventory
- Age– what products are getting old or close to expiry dates
- Too much– what products do I have more than “X” weeks supply of when comparing on-hand to regular sales (you supply the number based on the product, lead-time, or minimum order)
- Too little– what products do I have less than “X” weeks (you supply the number based on the product, lead time, or minimum order) supply when comparing on-hand to regular sales; or I promised a customer X quantity on hand at all times
- Total valuation– too high or low
- Category valuation– too high or low
Sales
- Margin– too low or too high
- On-time shipments– shipping too soon (delayed cash flow), shipping too late (customer dissatisfaction)
- What’s selling – what categories or products have increased in dollars, units or both
- What’s not selling – what categories or products are decreasing in dollars, units or both
- Who is buying– whose sales have increased, which categories have increased
- Who is not buying– whose sales have decreased; what categories have decreased
Purchasing
- Cost changes– too high or low (too low = is quality deteriorating or buying aged product)
- On-time shipments– shipping too soon (impaired cash flow), shipping too late (customer dissatisfaction)
- Order size– too big or too small
- Vendor purchase changes– category, items, or total – what impacts vendor contracts or relationships? Is there a problem with a buyer, a salesperson, a customer, or the vendor
- Whose inventory matches targets– training for purchasing, more visibility of “right level” of inventory, too many products or relationships to manage well
- What do I need to buy
Sales & Marketing Staff
- Activity level by a salesperson– too little, not correctly balanced
- Pipeline– too small, too big (not correctly qualified or big surge in business coming), too far out
- Prospects– not enough, not balanced, too many (can’t follow up on all of them)
- Lead analysis– status of leads
Generic Dashboards
Generic Dashboards provide a general idea of what someone else considers essential; however, this is all about you. What is important to you? Lean experts stress the importance of having one Dashboard. Too many “gauges” and you lose focus; too few, and you can’t get a good handle on your business.
It’s important to understand that each person or department needs a different dashboard. A Dashboard must be specific to the person’s task. The Dashboard should tell its user the most critical task; otherwise, tasks are overlooked.
All this information may already be available in your current system. However, to find it, you must run multiple reports, upload them into Excel, develop your pivot tables and graphs, and analyze the data. Oh, and then redo it every day. Not fun, not quick, not practical. However, that points out what is necessary.
Find the Source
You and your management team know what is vital for your business. Spend the time to categorize, distill, and discard. Keep what’s left and use that as your starting point. You will often find out what you thought the problem was is not. Finding the source(s) of the problem is critical if you want to solve the problem. (Read our blog, The Toyota Way, for more tips on finding the source of the problem).
There is an old saying, “The urgent will always make itself known; the important lies quietly waiting to be done until it’s either no longer important or it becomes urgent. The wise man or woman deals with the important before it becomes urgent.”
Ask yourself, “If the building were on fire (and I didn’t have a backup), and I could only grab one report, which would I grab? Accounts Payable, Accounts Receivable, or the Inventory Valuation Report?” Not a good position to be in, but we all make similar choices every day. Payables clamor for attention. Receivables lie quietly, waiting for you to follow up.
Free BI Dashboard Analysis
Dashboards bring critical items into view so you can deal with them on time. We provide a free analysis of your Dashboard, so call us at 763-571-8580, or complete our Contact Us form. We look forward to talking to you soon.
To learn more: Business Intelligence, Reporting, & Dashboards Are NOT the Same Thing


