Business Intelligence, Reporting, and Dashboards – Important Tools For Your Business
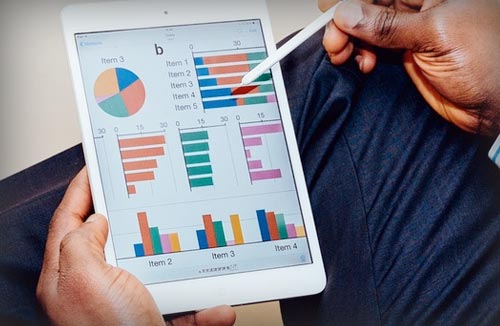
Business Intelligence meanings something different to everyone. We believe business intelligence is a dynamic tool that lets you distill data into information and then sift information into the critical pieces. The pieces provide you with the understanding you need to make good business decisions.
Like any intelligence gathering, your view of what is required will vary from the next person’s. You need to be able to drill down, rearrange, and change the model to answer all of the “what if”, “how come” and “why” questions that each new step brings.
Microsoft Power BI is one example of this category of software. Power BI helps you drill down, add or remove data, sorts, summarizations percentages in a dynamic mode across multiple databases. When implemented it improves your basis of information as you make your critical business decisions. It is simple, easy to use and one of our favorite tools.
Reporting
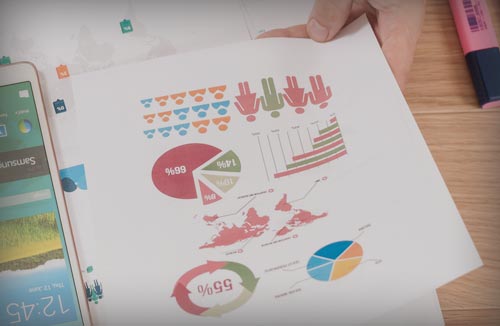
Reporting provides static information – the kind of reports you may view daily or weekly. Business Intelligence gives you the ability to drill down or “spin” the data to look at it differently – all without running a new report. ERP software includes stock reports that provide generic information based on what the developer thinks is appropriate.
When we review our customers reporting environment, we start by asking a question. “Is there is an area in which you believe you could make better decisions if you had the ability to arrange the information differently, or simply add in more information?”
We use reporting tools like Business Central AL (a programming language) or Microsoft SQL Reporting Services to pull specific reports on demand, modify existing reports, or create entirely new reports. We print the reports at the time or have them sent to you via email.
Dashboards
Dashboards can communicate critical real-time business measurements. They are a collection of measurements (like those on your car dashboard) which relay important and critical information in simple, easy to understand formats.
We can help you identify those pieces of critical information. We then design and implement the dashboards that best fit your company’s needs. Dashboard requirements vary depending on the function of the person using them. The same dashboard won’t work for a customer service rep, a purchasing agent and a manager because their needs are different.
It’s likely your Sales, Financial and Business Management, Administration, Customer Service, Purchasing, Inventory Control and other functional business areas all have different needs for their dashboards.
Client Testimonial
“This tool saves us tens of thousands of dollars in lost sales! Having instant access to our customers’ purchasing trends, we can immediately target those customers whose purchases are declining.”
Todd Boynton, President, Update, LTD.
We can help your business
Our service extends our capabilities to you so you ultimately become better, faster and stronger and achieve your business success. With Realistic Solutions© from BASM, you are in a great position to take advantage and move ahead of your competitors.
Since 1985, we have extended pragmatic advice and extensive business experience to our clients. With Realistic Solutions© from BASM, you get the right mix of technology and practical business experience for your business.
Contact us to learn how our services can save you time, money and frustration.


