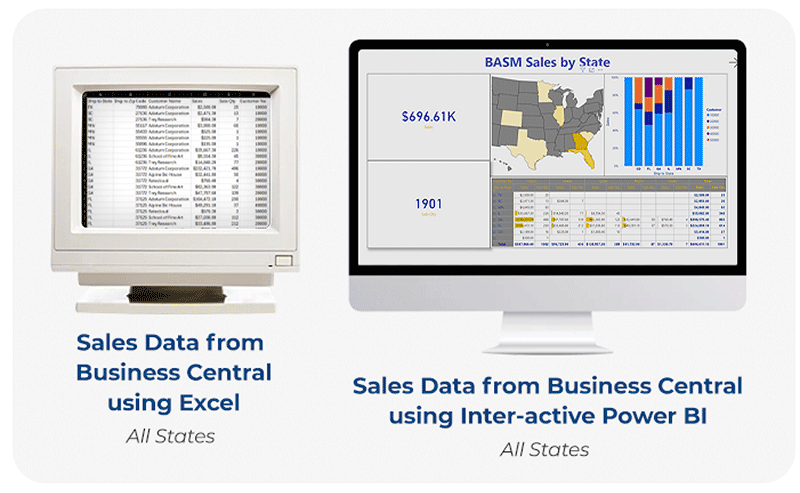
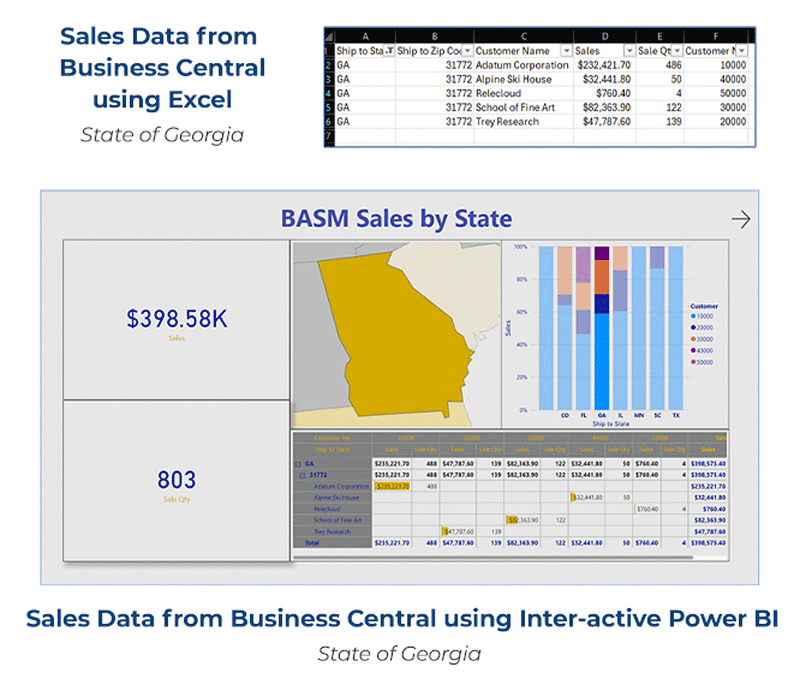
Power BI is a data visualization and business intelligence tool developed by Microsoft. It transforms raw data from various sources into meaningful, immersive, and interactive insights. Power BI is widely used by businesses to spot trends, track performance, and make data-driven decisions.
Key Features and Capabilities
Data Visualization
Power BI allows users to create interactive reports and dashboards that visualize data in various ways, including charts, graphs, and maps. This helps businesses to present data in a user-friendly manner.
Data Transformation
Power BI can transform raw data into useful information by cleaning and manipulating data. This ensures that businesses work with clean, accurate data that is easy to analyze.
Integration
Power BI integrates seamlessly with other Microsoft products such as Excel, SharePoint, Business Central and Teams. This enhances the workflow of projects and allows for easy data sharing and collaboration.
Have you wanted an easy to visualize Power BI report
but can’t find the time to create one?
We can help you with that!
SAMPLE List of Power BI Reports
Sales & Revenue:
- Sales by State
- Returns by State
- Sales & Returns by Inventory
- Sales Data by Month
- Sales Overview
- Sales (by Customer and Salesperson by Month)
- Sales Data by Customer
- Sales Comparison (Last Year vs Current YTD)
- Revenue Report (Summary & Detail)
- Summary by Year – Sales Comparison (by Salesperson)
Inventory:
- Usage by Month (Sold and consumed)
- Monthly Consumption
- Quarterly Consumption
- Price Increase
- Usage by Month
- E&O Reserve Analysis
- 80/20 Report
- Inventory Demand
- Return Reasons
Bookings & Orders:
- Open Purchase Orders
- Order Intake Comparison
- Summary Bookings
- Summary by Year – Order Intake Comparison (by Salesperson)
- Open Order Book
Data Metrics:
- Prior Date Data Metrics (revenue, planned ship value, bookings value, on time delivery requested, on time delivery promised)
- Month to Date Data Metrics
- Sales Price/Order Intake Comparison/ Open Order Book/Revenue vs. Target (YTD)
Commissions
- Monthly Sales Summary Commission
- Summary Sales
- Summary Sold To
- Summary Captured
To get 20% OFF your first Power BI Report, contact us at
877-571-8580
or email sales@bautomation.com
We’ve helped many organizations improve their operations with custom Power BI reports.
See some of these reports in action.
Power BI Videos
Connecting Power BI to Business Central
Power BI Finance Reports
Power BI Inventory Reports
Power BI Inventory Valuation Reports
Power BI Purchasing Reports
Power BI Sales Reports
Power BI Manufacturing Reports
Power BI Projects Reports


