
At times, it can feel like business leaders are in the midst of a technological whirlwind. The reporting capabilities of many business software solutions have vastly expanded, and it can be difficult to understand all the tools at your disposal, much less choose the correct one for each task.
Below, we explore the various reporting options available to you within and/or integrated with Microsoft Dynamics 365 Business Central. We’ll cover built-in features that negate the need to export data, seamless Excel integration, and over 70 pre-built Power BI reports. We’ll also take a look at modern enhancements like Analysis Assist with Copilot as well as powerful
Business Central Built-In Reports
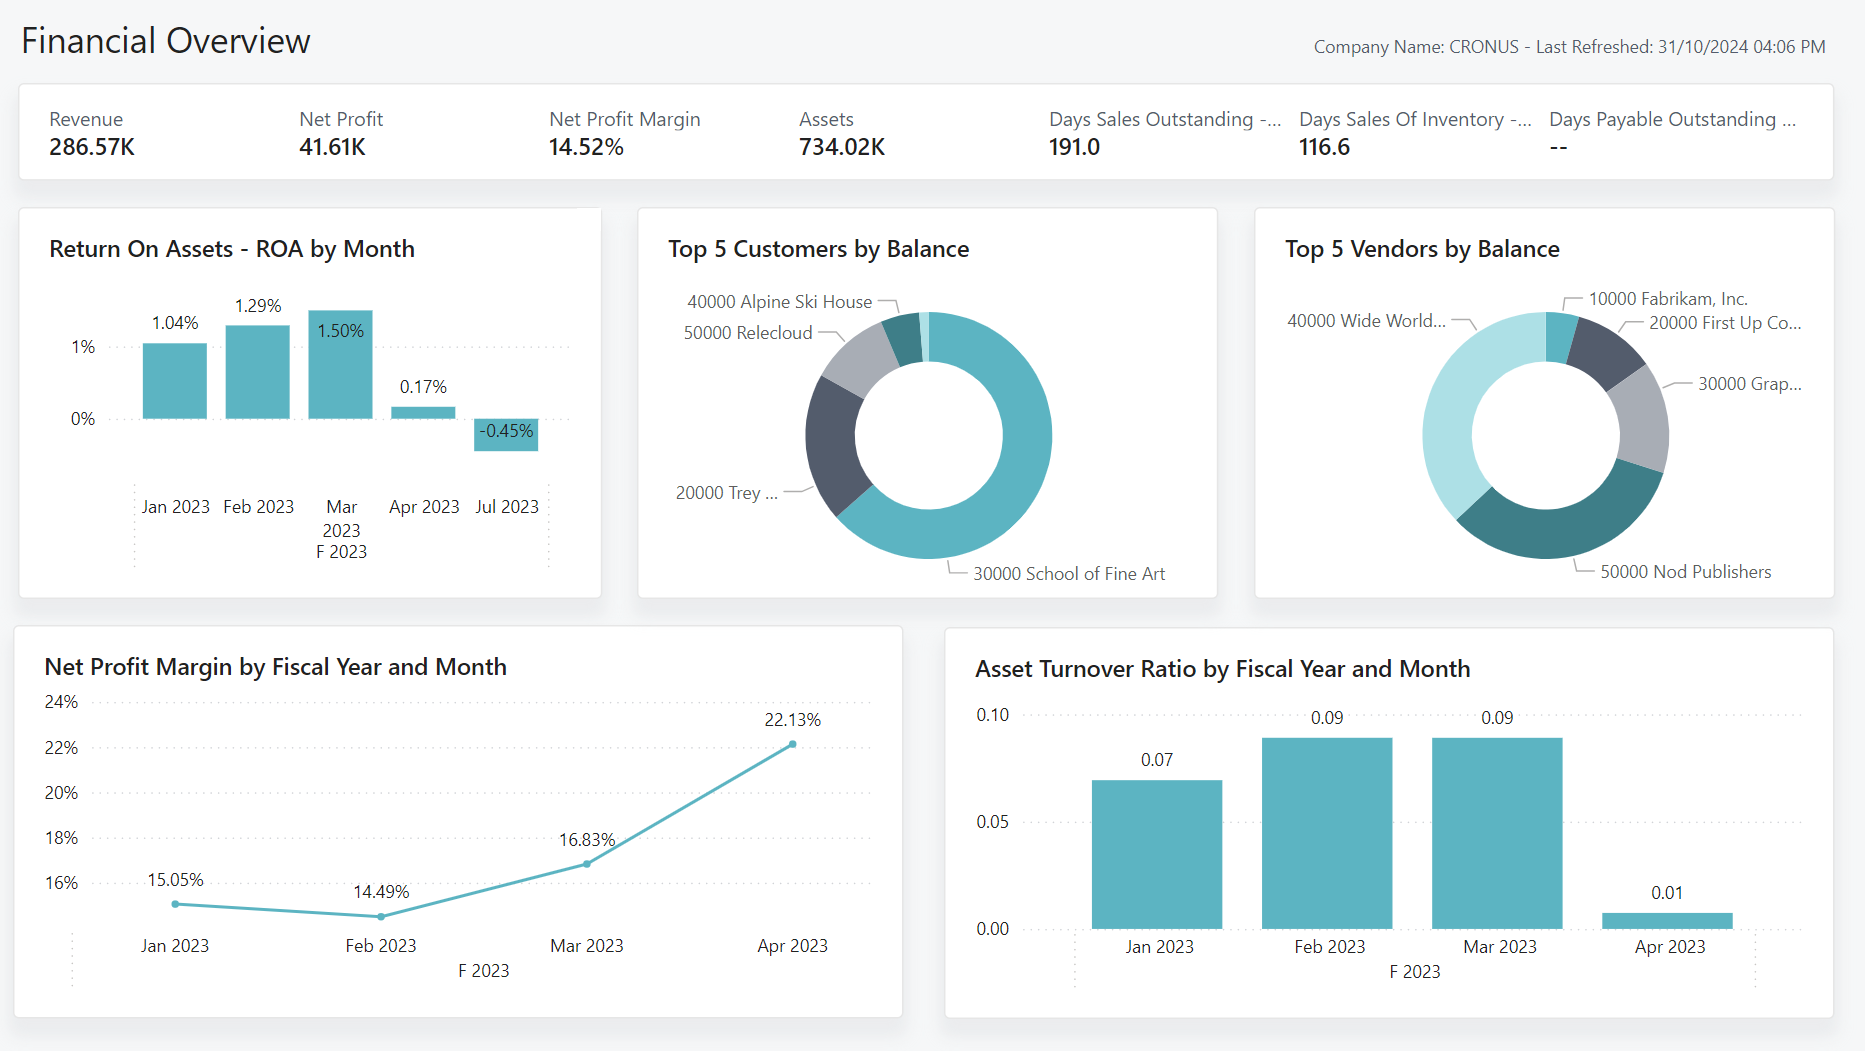
Before getting caught up in complex AI reports, it’s important to take advantage of your ERP’s built-in reporting features—and only then fill in the gaps with more powerful AI reports. Microsoft Dynamics 365 Business Central offers a suite of built-in reporting features through Data Analysis Mode, a tool that allows users to pivot, filter, and group data directly on list pages. There’s no need to export these reports to Excel, enabling staff to perform ad-hoc analysis within the secure environment of the ERP.
Business Central includes a robust Financial Reporting tool (formerly known as Account Schedules). This feature allows you to build custom balance sheets, P&L statements, and cash flow forecasts by mapping G/L accounts to specific rows and columns.
Beyond financials, the ERP provides over 300 standard report templates covering sales, inventory, and supply chain metrics, which can be viewed directly in a browser or scheduled for automated distribution. For a full list of the standard report templates and the tasks they’re useful for, click here.
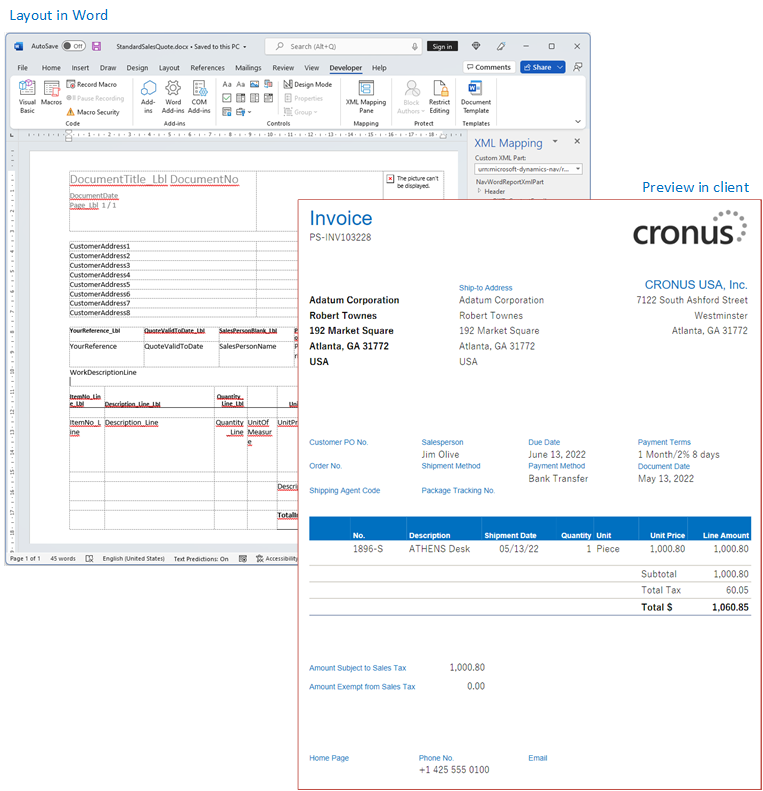
If those 300 reports aren’t enough, you can create custom reports in Microsoft Dynamics 365 Business Central. For layout adjustments, you can use the Word Report Layout feature, which enables simple drag-and-drop editing using familiar Microsoft Word tools. For more complex data sets, developers can use Visual Studio Code with the AL Language extension to define “Report Objects,” governing how data is retrieved from the database. Additionally, the Excel Layout feature allows users to design reports directly in Excel, accessing native formulas and charts that refresh automatically.
PowerBI
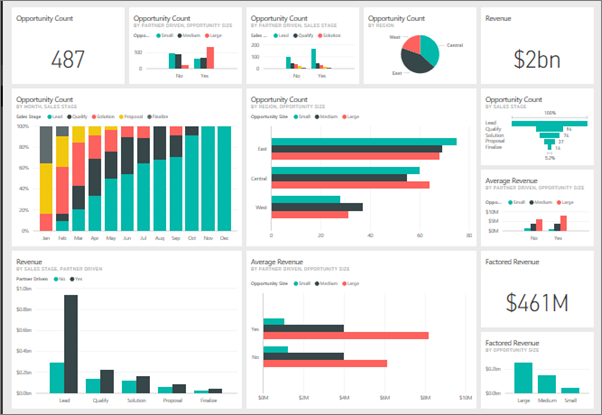
While the built-in reports in your ERP are already extensive, you may find that those reports don’t quite give you the level of insight you need into your business. The next reporting option to consider is PowerBI.
PowerBI is a business intelligence tool that provides data visualization, data transformation, and data integration. Before you even put data into a report, PowerBI can clean and manipulate that data for you, making the reporting process seamless. It then allows you to create interactive dashboards and reports full of charts, graphs, maps, or whatever other visualizations you may need.
We cover PowerBI in much greater depth on this webpage, and we walk you through everything you need to know to get started with BI dashboards here.
![]()
AI in BusinessCentral: Copilot
Once you have a basic reporting “ecosystem” running in your business, it’s time to think about how AI can help solve problems or streamline reporting processes. The first way you can accomplish this is with Microsoft Copilot.
The integration of Microsoft Copilot into Microsoft Dynamics 365 Business Central transforms the ERP into an intelligent, proactive assistant that automates labor-intensive tasks and refines predictive capabilities. Through natural language processing, employees can generate automated Power Automate workflows, draft marketing copy, and create sales orders or quotes simply by describing items.
Copilot significantly reduces manual data entry for reporting purposes. For example, it leverages historical sales and current orders to generate accurate inventory forecasts and comprehensive cash flow analyses with real-time data.
Copilot also provides an interactive chatbot and advanced predictive analysis. Users can request complex reports, graphs, and demand forecasts using simple text instructions rather than technical queries. Copilot shifts the focus from tedious data management to high-level oversight.
For a more in-depth overview of Copilot within Microsoft Dynamics 365 Business Central, check out this blog post.
AI Reporting: Cosmos
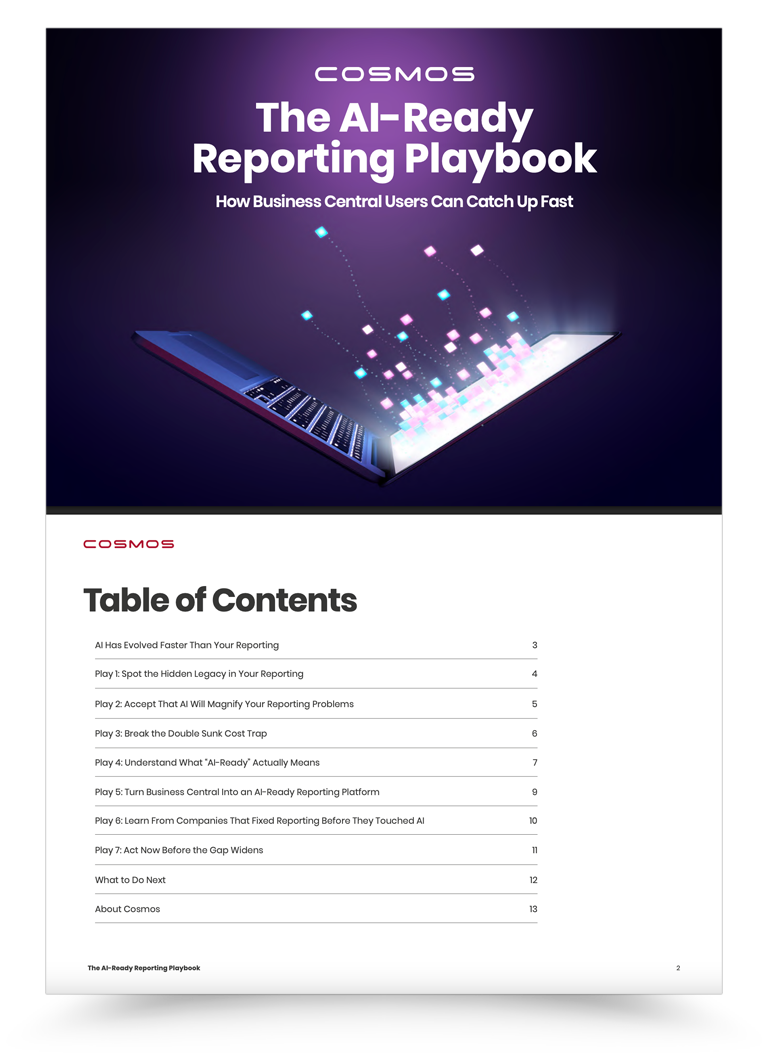
If you want your business to embrace AI reporting at a high level, consider integrating Cosmos with your ERP. Cosmos empowers AI reporting by serving as a high-performance data bridge between Microsoft Dynamics 365 Business Central and advanced analytical tools. Cosmos centralizes and cleanses complex ERP data into a unified, cloud-based data model. This architectural foundation is critical for AI because it provides the clean, structured datasets that machine learning algorithms require to generate accurate predictions.
Cosmos also creates a two-way connection with PowerBI, allowing users to access AI features like anomaly detection and natural language processing for data queries. Because Cosmos optimizes the underlying data structure, AI-driven insights can be generated up to 48 times faster than with traditional Excel-based tools. Cosmos removes the technical barriers associated with data science, allowing you to utilize AI-driven forecasting and trend analysis as well as stay on top of new AI reporting features.
To learn more about the powerful AI reporting features of Cosmos, as well as how to build your reporting foundation to be AI-ready, download our whitepaper.
Want to see the software in action?
To book a 30-minute demo with Cosmos, click here!

By the Way…
At BASM, we specialize in Microsoft Dynamics 365 Business Central. We’d love to have a conversation with you about your company’s reporting needs and what tools would be best to meet those needs. Reach out to us today to get started!