
Effective inventory management is critical for businesses seeking to optimize operations, improve profitability, and enhance customer satisfaction. In order to manage inventory effectively however, you need to be able to analyze your current inventory and spot pain points and opportunities for growth.
This article delves into methods for analyzing inventory. There are many different methods, but we’ll cover how to analyze inventory in relation to:
- Sales
- Economic Order Quantity (EOQ)
- Aging and obsolescence
We’ll also cover some practical recommendations and visual examples to guide strategic decision-making.
Of course, these analyses are time-consuming and often difficult to do. That’s where we come in: with BASM’s custom reports in Microsoft Dynamics 365 Business Central, you can access inventory analysis data with ease.

Methods of Inventory Analysis
Inventory Analysis: Sales Trends
Sales data provides the foundation for inventory planning. By analyzing historical inventory trends, businesses can identify peak demand periods and adjust stock levels accordingly.
One way to analyze historical inventory data is through an “ABC Analysis.” In this analysis, you categorize inventory into 3 groups:
- A: High-value items with low sales frequency
- High-value items require tight control to minimize holding costs. The best strategy is to create smaller, more frequent orders to avoid excess inventory.
- Example: A company selling premium electronics orders every two weeks to match demand closely and reduce storage costs.
- B: Moderate-value items with medium sales frequency
- Moderate-value items with steady demand can use medium-sized, moderately frequent orders.
- Example: An auto parts distributor places monthly orders for mid-tier inventory like brake pads to balance ordering and holding costs.
- C: Low-value items with high sales frequency
- Low-value, high-volume items can be ordered in bulk with less frequent replenishments.
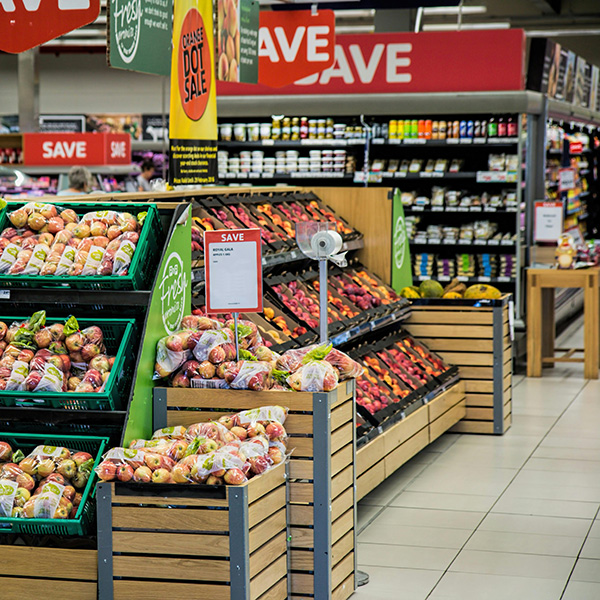
- Example: A grocery store orders large quantities of paper towels quarterly, leveraging economies of scale.
In order to determine which items fall into which category, you’ll need to monitor the inventory turnover rate (how quickly inventory is sold) and the stock-to-sales ratio (the balance between inventory and sales).
Once you’ve identified items in each category, it may be more meaningful to calculate these metrics for A items, B items, and C items rather than on gross sales and gross inventory. This will provide more insight to balance your inventory based on the type of sale rather than an overall blunt calculation based on all sales.
Examples of Sales Trends Analysis
 1. Retail Clothing Store
- Inventory Turnover
- Annual cost of goods sold (COGS): $300,000.
- Average inventory: $50,000.
- Inventory turnover rate: 6.
- Interpretation: The store turns its inventory six times per year, typical for a clothing retailer balancing seasonal trends.
- Stock-to-Sales
- Monthly stock: $50,000.
- Monthly sales: $25,000.
- Stock-to-sales ratio: 2:1.
- Interpretation: The store has two months of inventory on hand, which is typical for a seasonal clothing retailer.
 2. Electronics Retailer
- Inventory Turnover
- Annual COGS: $600,000.
- Average inventory: $100,000.
- Inventory turnover rate: 6.
- Interpretation: This indicates the retailer sells through its inventory six times annually, suitable for mid-range electronics.
- Stock-to-Sales
- Monthly stock: $100,000.
- Monthly sales: $50,000.
- Stock-to-sales ratio: 2:1.
- Interpretation: The ratio indicates that the retailer carries inventory for two months of sales, suitable for higher-value products with lower turnover rates.
 3. Supermarket
- Inventory Turnover
- Annual COGS: $1,800,000.
- Average inventory: $200,000.
- Inventory turnover rate: 9.
- Interpretation: The supermarket turns its inventory nine times annually, reflecting high product turnover typical in grocery retail.
- Stock-to-Sales
- Monthly stock: $200,000.
- Monthly sales: $150,000.
- Stock-to-sales ratio: 4:3.
- Interpretation: The store holds just over a month’s worth of inventory, reflecting the fast-moving nature of grocery items.
 4. Luxury Goods Store
- Inventory Turnover
- Annual COGS: $1,200,000.
- Average inventory: $1,000,000.
- Inventory turnover rate: 1.2.
- Interpretation: The low turnover reflects the high-value, slow-moving nature of luxury items.
- Stock-to-Sales
- Monthly stock: $1,000,000.
- Monthly sales: $100,000.
- Stock-to-sales ratio: 10:1.
- Interpretation: The higher ratio reflects the slower turnover typical of luxury items and the need for a broader selection.
Inventory Analysis: Economic Order Quantity (EOQ)
Let’s move on to our second inventory strategy. The Economic Order Quantity (EOQ) model determines the optimal order quantity that minimizes total inventory costs. These costs include ordering costs (the cost of placing orders) and holding costs (the cost of carrying inventory). EOQ determines the optimal order quantity to minimize total inventory costs. The formula is:
Where:
- D: Annual demand (units).
- S: Ordering cost per order.
- H: Holding cost per unit per year.
 EOQ Calculation Example:
- Annual demand: 10,000 units.
- Ordering cost: $50/order.
- Holding cost: $2/unit/year.
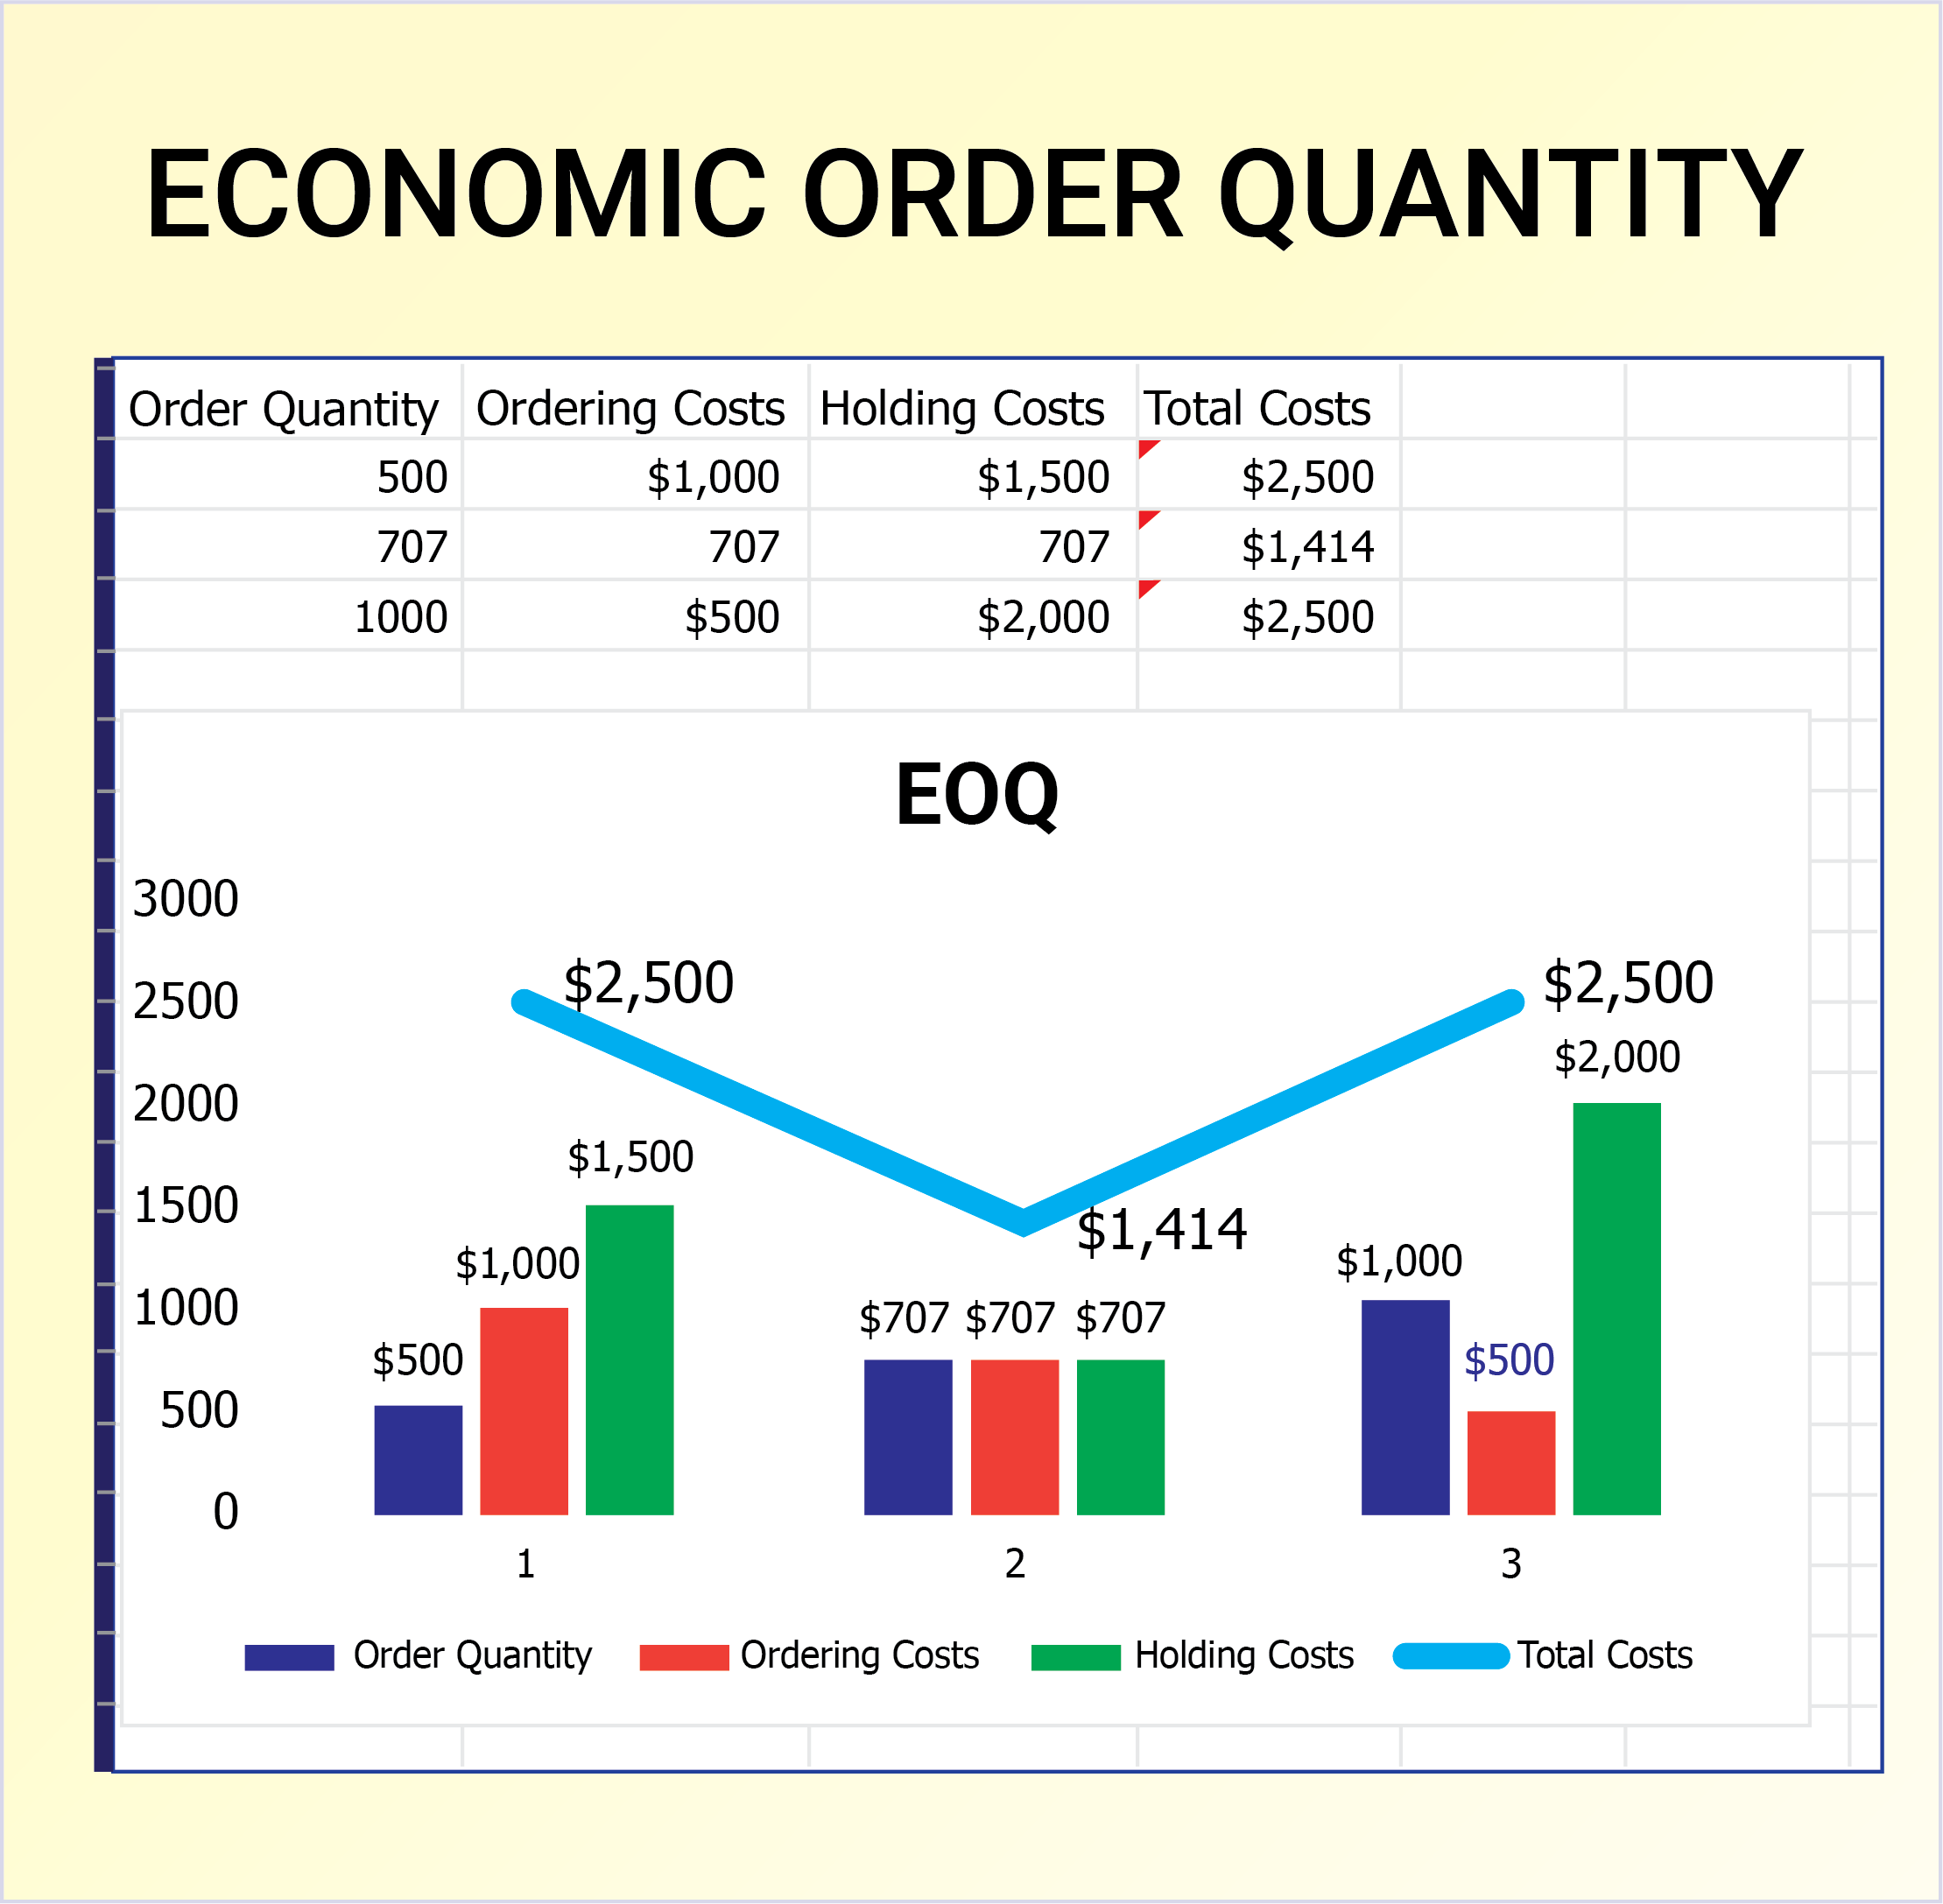
Detailed Cost Calculations:
- For an order quantity of 500:
- Number of orders/year: 10000/500=20
- Ordering costs: 20*50=1000
- Holding costs: 500/2*2=500
- Total costs: 1500
- For the EOQ of 707:
- Number of orders/year:10000/707=~14.14
- Ordering costs: 14.14*50=~707.21
- Holding costs: 707/2*2=707
- Total costs: 1414
- For an order quantity of 1000:
- Number of orders/year:10000/1000=10
- Ordering costs: 10*50=500
- Holding costs: 1000/2*2=1000
- Total costs: 1500
This demonstrates that the EOQ minimizes total costs at $1,414, while order quantities of 500 and 1000 have higher but identical total costs of $1,500, highlighting the tradeoff between ordering and holding expenses.
 What Are Ordering Costs?
In the context of EOQ, ordering costs refer to the fixed expenses incurred each time an order is placed, regardless of order size. These costs include:
1. Administrative Costs
- Purchase order processing (e.g., preparing, reviewing, and issuing orders)
- Invoice handling and payment processing
- Communication costs for coordinating with suppliers
2. Transportation and Shipping Costs
- Fixed freight charges independent of order quantity
- Customs and duties (if applicable)
3. Supplier Management Costs
- Vendor relationship management and contract negotiations
- Supplier setup costs for new or updated vendors
4. Quality Inspection Costs
- Labor for receiving and inspecting goods
- Sampling and testing expenses for ensuring compliance
5. Procurement Technology and Systems
- Software fees allocated to order processing
- Transaction costs (e.g., bank or payment platform fees)
6. Documentation and Compliance
- Regulatory documentation for industries with specific legal requirements (e.g., firearms or explosives)
- Record-keeping and audit preparation
These ordering costs are separate from unit costs and holding costs, and are a key component in determining the EOQ.
 What are Holding Costs?
Holding costs, also known as carrying costs, are the expenses incurred to store and maintain inventory over a given period. These costs include:
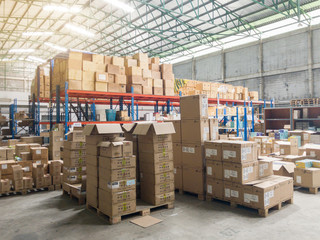
1. Storage Costs
- Rent or depreciation for warehouse space
- Utilities (e.g., lighting, heating, or cooling) specific to inventory storage
- Costs of shelving and storage equipment
2. Insurance
- Coverage for inventory against risks such as theft, fire, or natural disasters
3. Depreciation and Obsolescence
- The decline in value of inventory due to aging, technological advancements, or changes in market demand
- Costs associated with unsellable or obsolete stock
4. Material Handling Costs
- Labor and equipment required to move, organize, or retrieve inventory within a warehouse
5. Capital Costs
- Opportunity costs of capital tied up in inventory rather than being invested elsewhere
- Interest expenses if inventory is financed
6. Shrinkage
- Losses due to theft, damage, or errors in inventory management
7. Administrative Costs
- Costs of managing inventory records, stock audits, and warehouse operations
Holding costs are typically expressed as a percentage of the total inventory value and can vary significantly depending on the industry and type of goods stored.
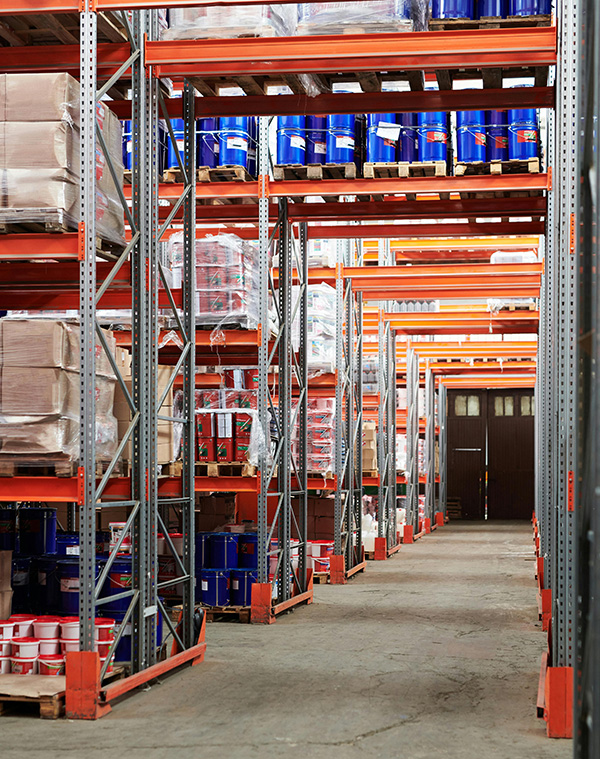
Holding Cost: Storage
Some of the biggest holding costs come from storage. In order to decrease your storage costs, focus on lean manufacturing and Just-in-Time (JIT) practices. In one example, storage density, improved by vertical shelving adjustment, increased warehouse capacity by 25%. You can use layout optimization tools including:
1. AutoCAD: Widely used for designing efficient warehouse layouts.
2. SketchUp: Provides 3D modeling tools to visualize warehouse configurations.
3. AnyLogic: Simulation software to test warehouse workflows and optimize space usage.
4. FortnaOptislot DC: Focuses on slotting optimization to improve picking efficiency and space utilization.
Holding Cost: Aging and Obsolescence
Another key holding cost is Depreciation and Obsolescence. It’s important to analyze the aging and obsolescence in your inventory. Aging reports help identify slow-moving inventory. Key strategies include markdowns (putting aging products on sale) and FIFO.
FIFO (First In, First Out)
FIFO stands for First-In, First-Out, which means that the oldest inventory items (the first ones that were stocked) are sold or used first. This method ensures that inventory is rotated regularly, reducing the risk of items becoming obsolete or expired. By selling older stock first, FIFO helps minimize the chances of inventory becoming obsolete or going bad. This is especially important for perishable goods or products with a limited shelf life. In order to implement FIFO, you need to track the purchase dates of inventory items as well as organize physical storage accordingly.
Inventory Level Analysis
Now that we’ve looked at key inventory costs, let’s look at how to choose the right level of inventory in your operations. Businesses often struggle with the balance between overstocking and stockouts. Overstocking results in high holding costs and low turnover rates, while shortages from stockouts can greatly affect customer satisfaction.
Here’s some generalized advice to follow when considering your own inventory levels:
 Inventory Turnover Rates
Ideal inventory turnover rates indicate efficiency. The ideal rate depends on the industry. Retailers may expect to see 6–12 turns/year, while manufacturers should see 4-8 turns/year.
Manufacturing Inventory Guidelines
Let’s take a closer look at guidelines for the manufacturing industry:
1. Raw Materials:
- Maintain 1.5–2 months of inventory based on lead times and production schedules.
2. Work-in-Progress (WIP):
- Keep 2–4 weeks of inventory, depending on production cycle times.
3. Finished Goods:
- Hold 1–2 months to meet customer demand and manage variability.
The Safety Stock Factor: 1.2
The safety stock factor is a crucial component in inventory management that helps businesses ensure they have enough inventory to cover unexpected fluctuations in demand or supply chain disruptions. Safety stock is an extra quantity of inventory that a business maintains to prevent stockouts caused by variations in demand and supply. It’s like a buffer that acts as a safeguard against uncertainties.
The generally recommended safety stock factor of 1.2 is derived from standard inventory management practices and statistical modeling:
1. Statistical Basis:
- The factor corresponds to approximately 84% coverage of potential demand fluctuations during lead time, assuming a normal distribution.
- This aligns with a standard deviation multiplier (-score) of 1.28 for a desired service level of 90%.
2. Service Level Considerations:
- For higher service levels (e.g., 95%), a higher multiplier (1.64) is used.
- For moderate variability and typical demand, 1.2 is a practical balance between overstocking and risk of stockouts.
3. Industry Adaptations:
- Stable industries (e.g., consumer goods): Lower factors like 1.1.
- High-variability industries (e.g., fashion, electronics): Higher factors like 1.5–2.
While your safety stock factor may vary, it’s important to base your stocking decisions on data and analytics, not just a gut feeling!
Visualizing Inventory Metrics
 Let’s take a look at some numbers. Sometimes it’s easier to visualize the benefits of cost reduction!
Here are two examples of inventory visualizations.
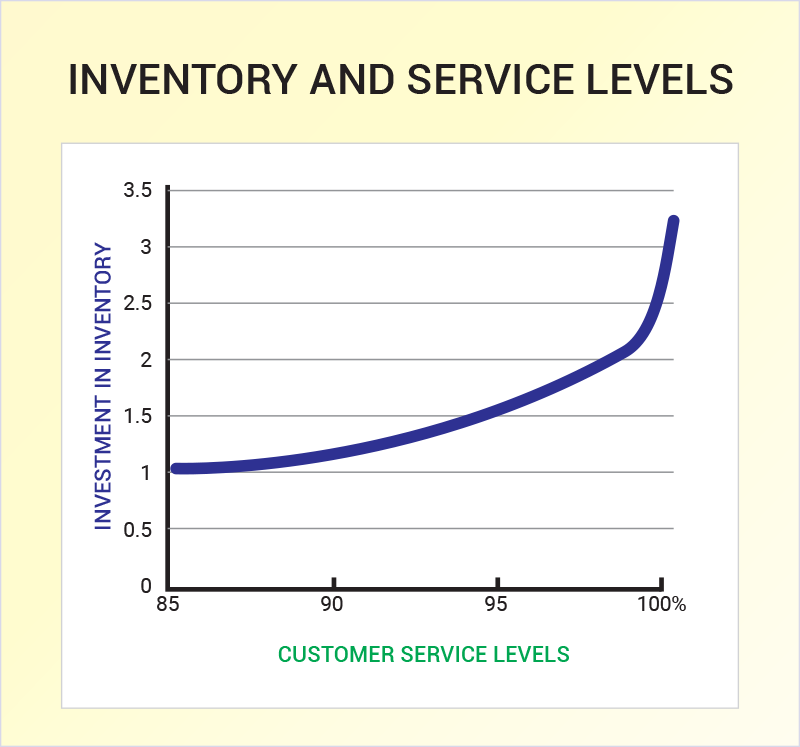
Inventory and Service Level
- Higher service level requires significantly higher inventory on hand.
- Chart from APICS magazine King_SafetyStock.pdf shows that 95% service level requires nearly 30% more inventory than a 90% service level.
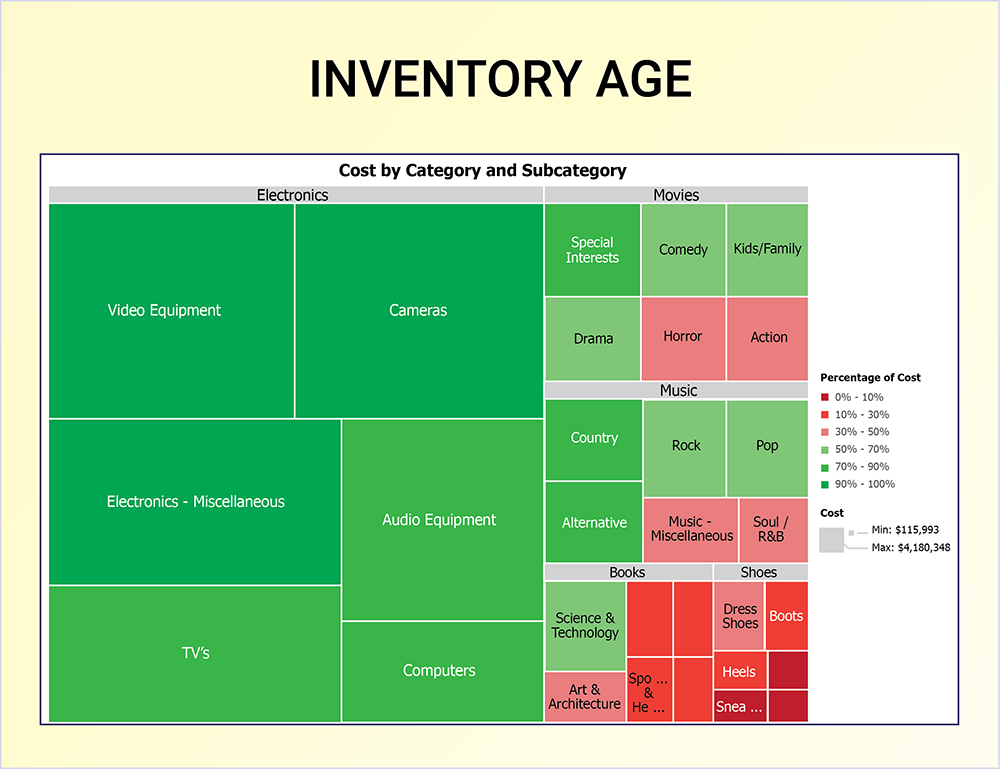
Inventory Age
- This illustration conveys the age of various categories of inventory including cost as a factor.
- This could also be strictly age and cost to simplify the visual.
Conclusion
Inventory analysis can cut costs in many ways. For example, imagine a manufacturing company that used EOQ analysis and turnover monitoring. By implementing reduced batch sizes, they could decrease inventory holding by 20%. By enhancing their forecasting abilities, they could improve turnover from 4 to 6 turns per year. These improvements could reduce total inventory costs by 15% while simultaneously increasing customer satisfaction by 10%.
Strategic inventory analysis enhances operational efficiency, reduces costs, and ensures customer satisfaction. By leveraging tools such as EOQ, aging reports, and turnover rates, businesses can make informed decisions. Incorporating visual aids and continuous monitoring ensures optimal inventory management, fostering long-term success.
BASM Can Help
Looking for a tool to help you get this all done? Business Central and Power BI can help you drill down, add or remove data, sort, and get summarization percentages in a dynamic mode across multiple databases. When implemented, it improves your basis of information as you make your critical business decisions. It is simple, easy to use and one of our favorite tools. If you’re interested in implementing Business Central in your business, we’re here to help!
Here at BASM, we can also create custom reports for your business to analyze your inventory in any way you’d like. If you’re interested, contact us today.
Case study and examples are generalized examples derived from standard inventory optimization principles and typical outcomes reported in supply chain management literature. They are not tied to a specific company or proprietary study discussed in the reference materials and experience.
References:
- Chopra, S., & Meindl, P. (2019). Supply Chain Management: Strategy, Planning, and Operation.
- Silver, E. A., Pyke, D. F., & Peterson, R. (1998). Inventory Management and Production Planning and Scheduling.
- Nahmias, S. (2009). Production and Operations Analysis.